Featured Scientist

Ming-chih Chen
Chen, Ming-Chih
University Distinguished Research Professor & Dean of Research and Development
Education:Ph. D., Industrial Engineering, Texas A&M University, U.S.A.
Specialties:Production and Operation Management, Total Quality Management
Cost-effectiveness of diabetic retinopathy screening for newly diagnosed type 2 diabetic patients: A nationwide population-based propensity score-matched cohort study
Aims: This study investigated the association between the frequency of screening for diabetic retinopathy (DR) versus the development of DR and corresponding medical expenses among patients newly diagnosed with type 2 diabetes mellitus (T2DM).
Methods: This longitudinal, population-based study used the Taiwan National Health Insurance Research Database (2004 to 2020) as a data source. Propensity score matching (PSM) (sex, age, comorbidities and concurrent medication use) was employed in the grouping of T2DM patients according to different frequency of DR screening. Outcome measures included the proportion of patients who developed DR, who received DR treatment, and the associated medical expenses and hospitalizations.
Results: The 17-year cohort included 337,046 patients. After PSM, three groups each containing 35,739 patients were assembled and analyzed. Compared to low-frequency screening, high-frequency screening was more effective in detecting patients requiring treatment; however, the net cost for treatment was significantly lower. Standard-frequency screening appears to provide the best balance in terms of DR detection, diagnosis interval, the risk of DR-related hospitalization, and DR treatment costs.
Conclusions: In this real-world cohort study covering all levels of the healthcare system, infrequent screening was associated with delayed diagnosis and elevated treatment costs, while a fundus screening interval of 1–2 years proved optimal in terms of detection and medical expenditures.
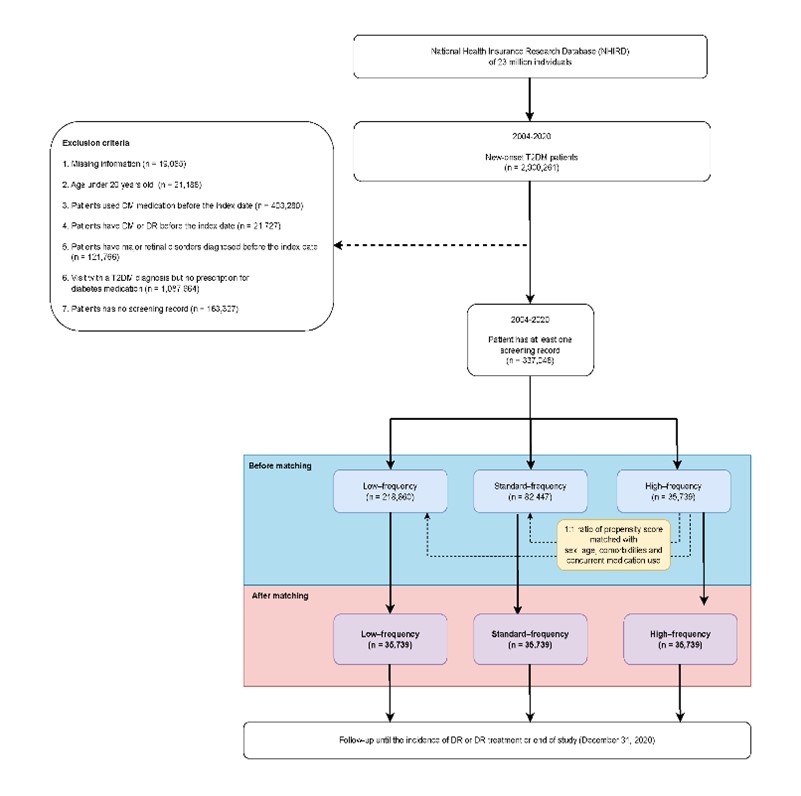
Fig. 1. Flow chart showing group selection process.
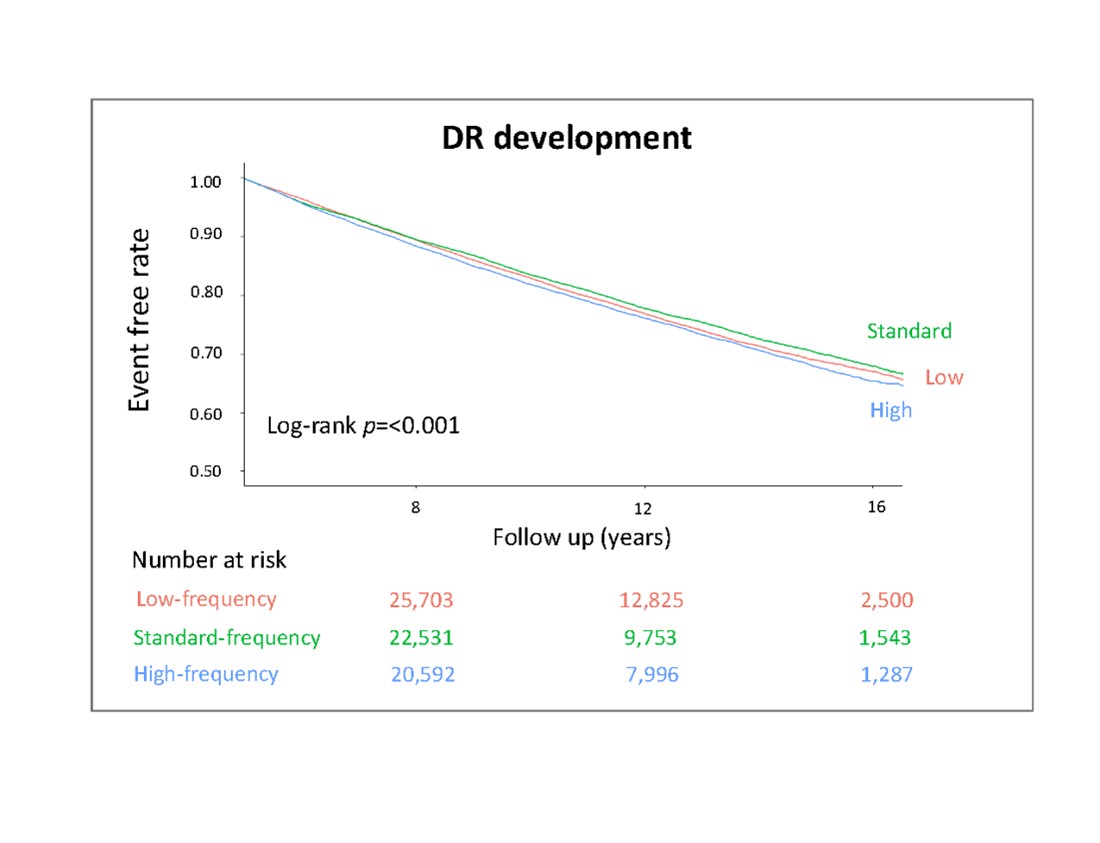
Fig. 2. Kaplan–Meier curves of DR development.
80 views